Energy in one picture.
Connection requests, heat planning, resilience duties, local acceptance: almost every question on your desk has a place. SovAtlas puts installations, roofs, terrain and risks into one 3D picture, in the browser and without installation.

The film shows roofs coloured by their solar suitability, the click panel of a rooftop installation from the core energy market data register, wind turbines as 3D models, sun and shadow over a city, a raised water level in a river valley and buildings in the colour of their critical infrastructure sector.
- Which roof can carry solar? Solar suitability per building
- What has already been built? Installation on click · energy market register
- Wind power in 3D. Wind turbines in the landscape
- Sun and shadow. At any hour of the year
- Play it through before it is urgent. Water level as a horizontal surface
- What around the site is critical. Critical infrastructure by sector
Trailer, 37 seconds: solar roofs, an installation on click, a wind farm in 3D, sun and shadow, a water level and the colouring of critical infrastructure. All footage taken from the product.
Four tasks, one picture.
Whether grid company, regional supplier or municipal utility: grid, sales, generation and crisis team look at the same area, with different questions.
The grid in context
- Generation sites, buildings and terrain in one picture.
- Flood zones, official warnings and weather over your own installations.
- High and extra-high voltage with substations on maps with a password or personal access link.
Connection requests for solar, storage, heat pumps and charging points
Find the next solar roofs
- Solar suitability and estimated annual yield per building.
- Sun and shadow at any hour of the year.
- Buildings with height, footprint and use as a basis before heat planning starts calculating.
PV contracting, residential solar supply, heat planning
Sites that get approved
- Wind turbines in 3D, with manufacturer and hub height on click, where recorded.
- The viewshed from hub height or total height.
- Protected areas, drone zones and parcels in the same picture.
Area targets for wind energy, repowering
What happens in the surroundings?
- Hospitals, waterworks and residents around a site, on a password-protected map.
- Drone geo-zones, reported aircraft and disrupted satellite positioning.
- The crisis plan for the scenario is drawn up in KRITISplan, based on BSI Standard 200-4.
German KRITIS umbrella act in force since 17 March 2026
Which roofs can carry solar, and how much?

The roofs show their suitability for photovoltaics, calculated from pitch and orientation in the 3D model. A click lists suitability, pitch, orientation and the estimated annual yield.
Sales sees the large, well-suited roofs of a business park at a glance: the candidates for contracting and roof leasing. In residential areas the map shows the roofs of large apartment buildings, the candidates for residential solar supply.
- Solar suitability and estimated yield per building, roof pitch and orientation on click
- Sun position and shadow by date and hour
- Buildings and solar suitability for your grid area
- A list of suitable roofs per area for your sales team
- A comparison with installations already registered
What has been built, how big, since when?
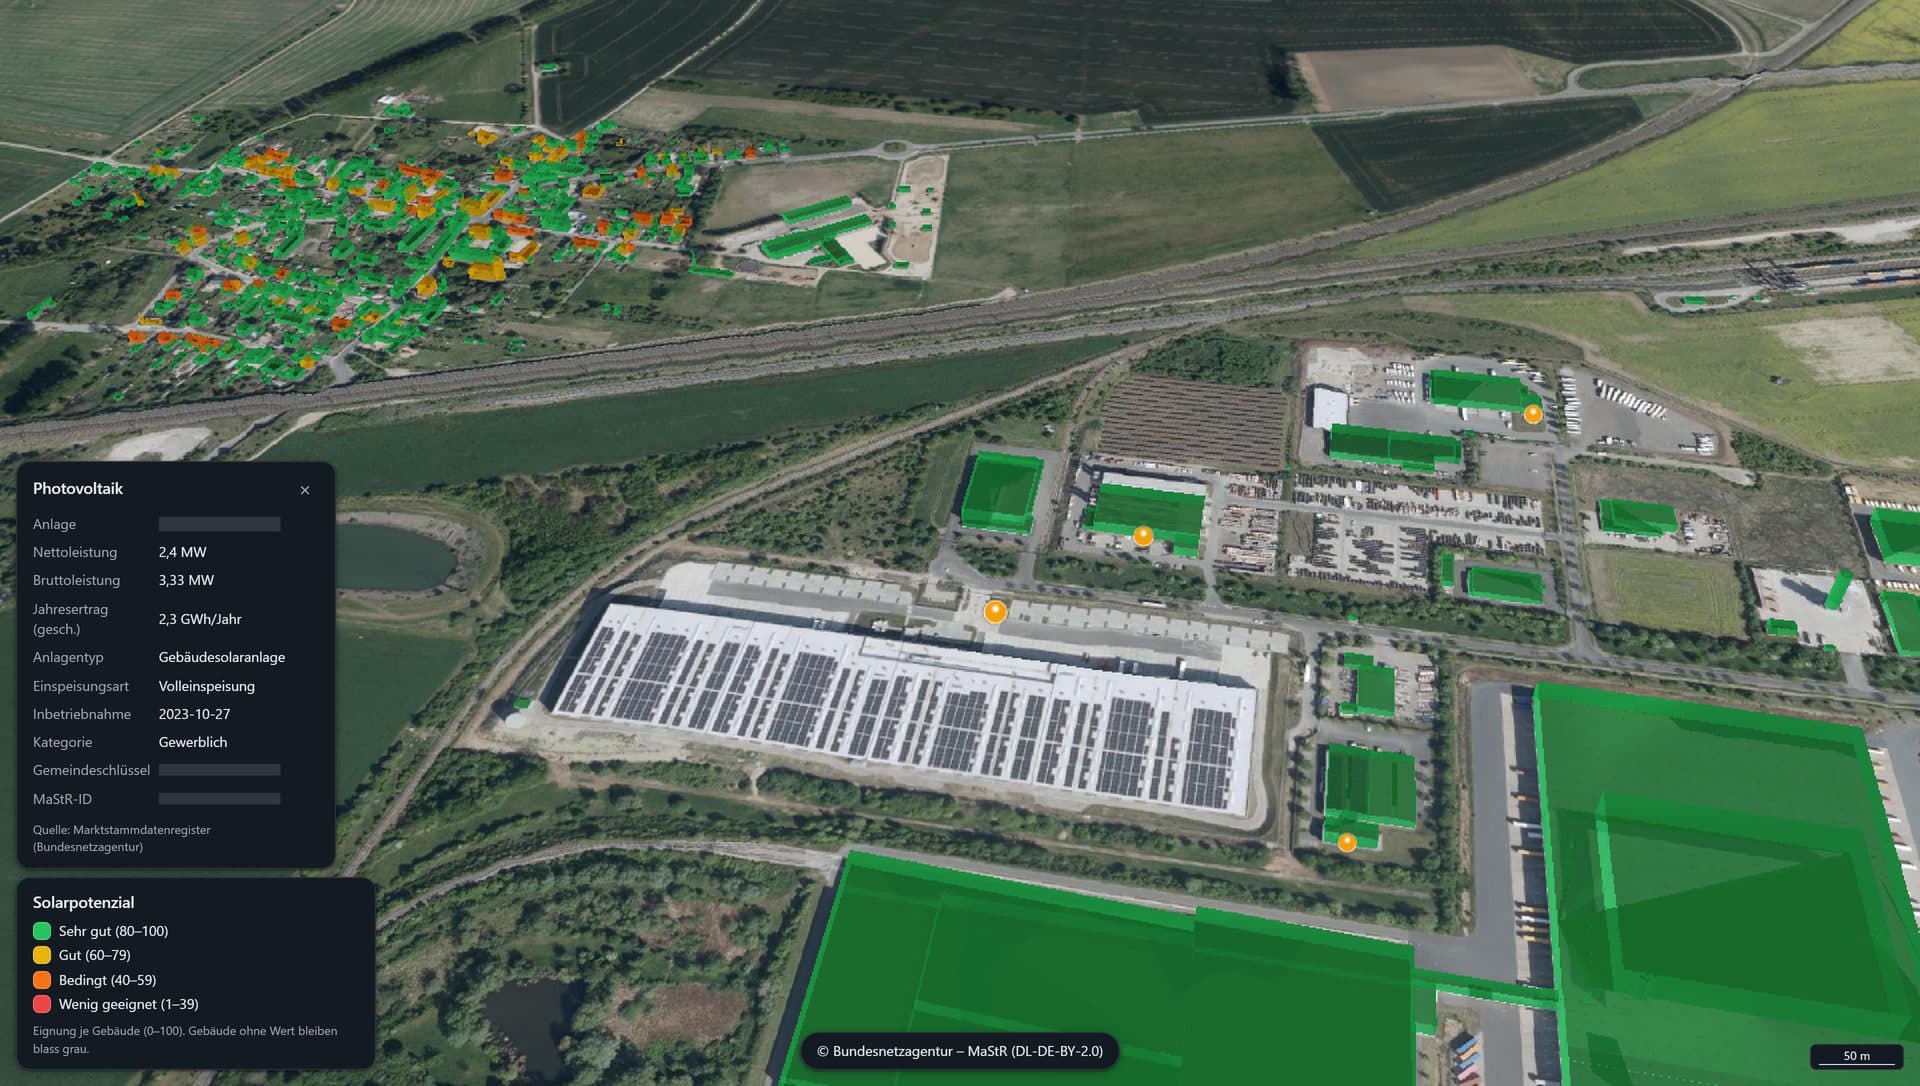
The large installations with a location from the core energy market data register: solar parks, rooftop systems, wind, biomass, hydropower and storage. A click shows the profile, here a rooftop system with 2.4 MW net rated output, in operation since October 2023, with full feed-in.
Who feeds in within the area, how much and since when: for grid planning, direct marketing and the conversation about repowering when an installation's subsidy ends.
- Installations and storage with a location, filterable by technology, profile on click
- A filter by year of commissioning: which installations will leave the feed-in tariff in the coming years
- Your own installations and grid connection points as a layer on top
How does the wind farm sit in the landscape?
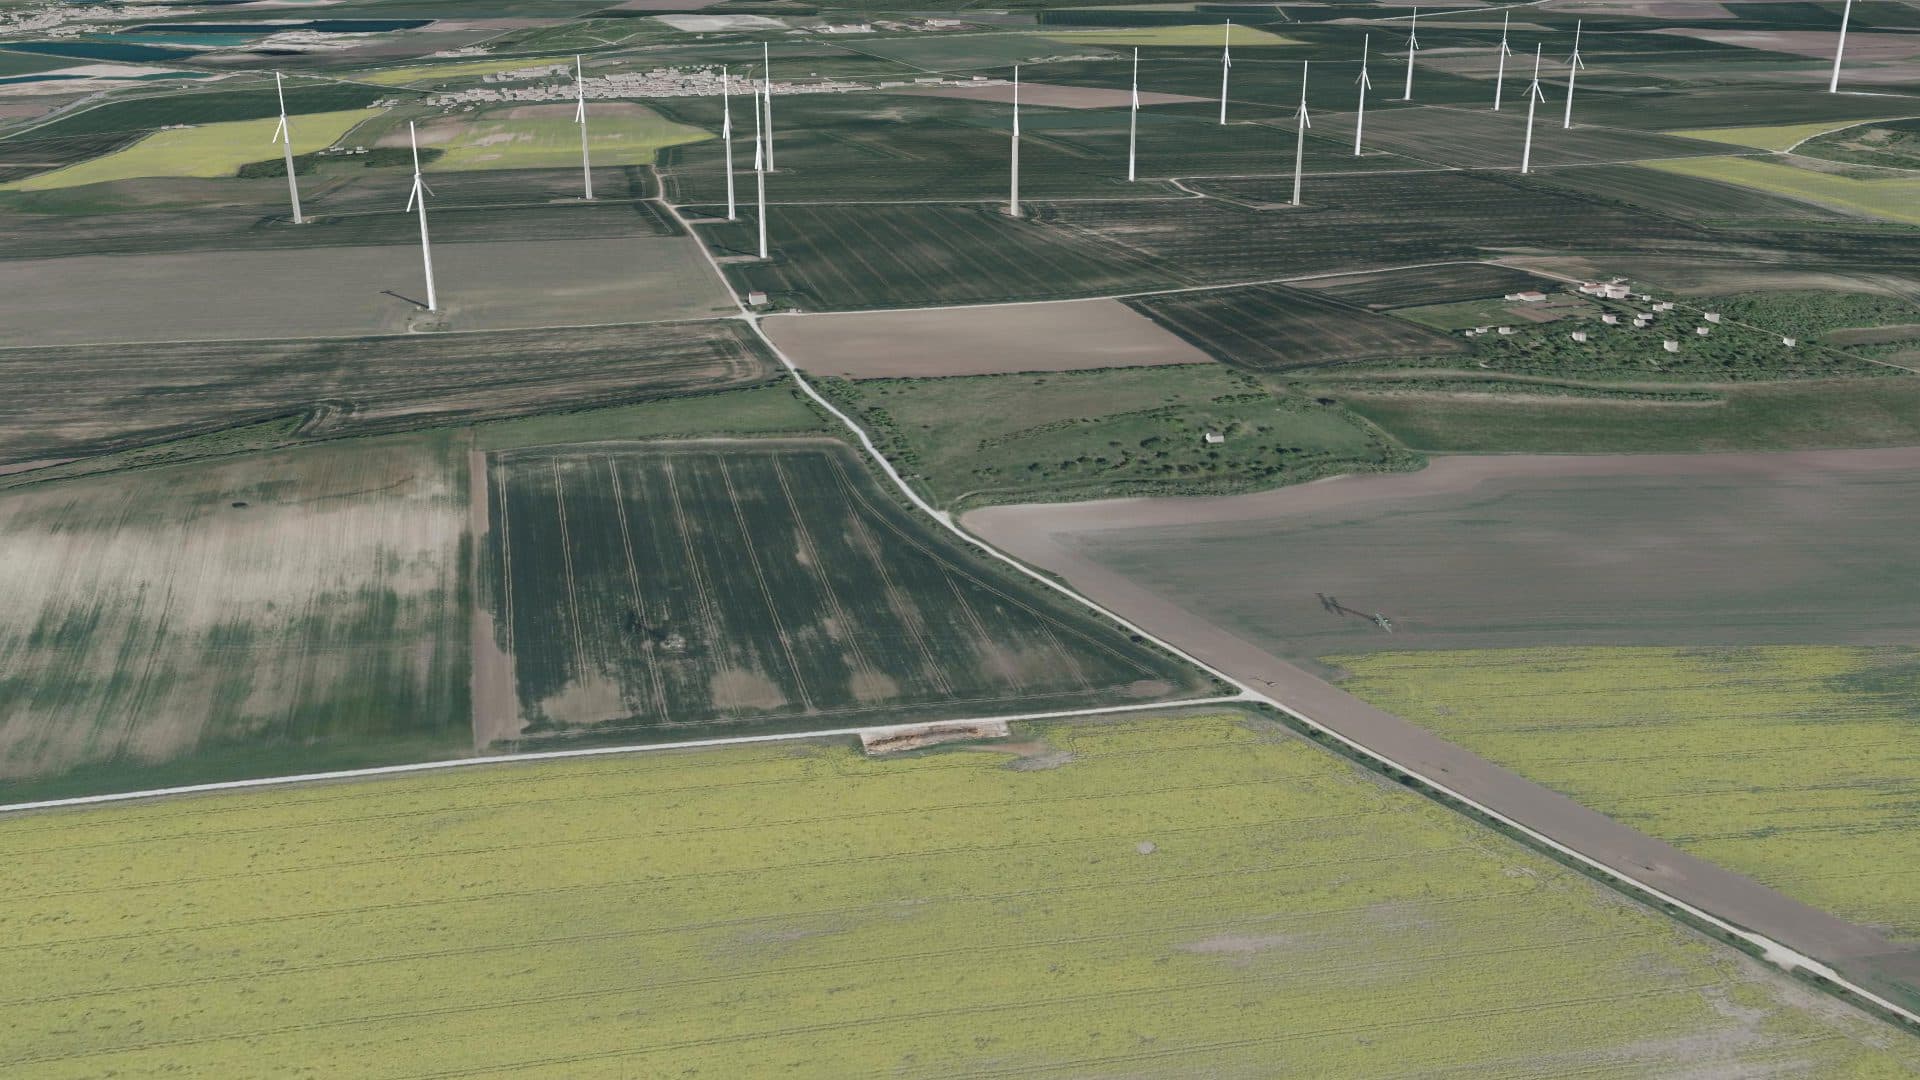
Germany's wind turbines are on the map, close up as 3D models with tower and rotor in the landscape. A click shows manufacturer, output, hub height and commissioning date, where recorded.
For a planned site, the viewshed raises the observer to hub height or total height and shows which settlements would see a turbine there. A wind farm thus enters the public meeting with pictures instead of claims.
- Wind turbines in 3D with a profile on click
- The viewshed from up to 500 metres
- Priority areas for wind energy from regional planning in the same picture
- Your planned wind farm as a 3D model at its site
Where does the line run, and what connects at the substation?

High- and extra-high-voltage lines coloured by voltage (110, 220 and 380 kV), substations and switching stations down to local substations as symbols, where OpenStreetMap records them, over aerial imagery, terrain and 3D buildings. A click shows name, voltage and operator where OpenStreetMap records them.
Generation, grid and consumption in one picture: the solar park next to the substation, the line above the business park, the housing behind it. Anyone discussing connection, expansion or local acceptance shows the place instead of describing it.
- Lines from 110 kV and stations down to local substations from OpenStreetMap, across Germany
- Only on maps with a password or personal access link
- Your medium- and low-voltage grid as a layer of its own
- Your own stations and outages in the same picture
What happens around the site?

Buildings are coloured by their critical infrastructure sector: health, supply, education, state and administration. Drone geo-zones, reported aircraft, disrupted satellite positioning, residents, warnings and weather can be added.
Since March 2026 the German KRITIS umbrella act applies: operators analyse their risks, plan their resilience and report incidents. Many of these risks have a place, and the map shows it.
- Colouring by sector and facilities in the surroundings
- Power grid and KRITIS layers on protected maps only
- Your installations and your distribution grid as a protected layer
- A crisis plan for the same scenario with KRITISplan
Your data in the same picture.
The map brings what is openly available. Its value grows when your own information is added, protected and visible only to those who should see it.
- Local substations, medium voltage, charging points, construction sites, faults, properties and points of interest
- Energy market data register, wind turbines, storage
- High and extra-high voltage with substations, on maps with a password or personal access link
- Flood zones, official warnings, weather, drone geo-zones, air traffic
- 3D buildings with height, use and solar suitability
- Terrain, aerial imagery, parcels, standard land values, population density
- Documents per building: data sheet, photo, video, 3D tour or your specialist application, opened with a click on the building.
- Embed open maps in your intranet or customer portal, controlled through a programming interface.
- Access per map, protected by password or personal access link.
- Your grid and specialist data straight from your GIS, connected via WMS or WFS.
- Your points of interest with symbol, profile and link.
- A public solar roof map for your customers.
What getting started looks like.
We show you your area in one picture, around your questions rather than our slides.
Demo
One hour, your questions: wind power, drone zones and warnings in your area, roofs and installations in an example city.
Pilot project
A protected map for your grid area, with buildings, solar suitability and installations there and your first data; defined scope, defined term.
Expand
More maps for more departments, your specialist data as layers and, if you wish, a public map.
To take away and pass on.
Topic sheet: Energy
Two pages to pass on: solar roofs, installations, wind power and the power grid with examples from the product, plus how to get started.
Paper “Energy in one picture”
Twelve pages on grid, installations, solar roofs, wind power, flooding and critical infrastructure, with examples from the product. We are happy to send it to you.
Which grid area should we show you?
In a demo you see SovAtlas on your grid area, with whatever data is already available there today.